Solutions · Usage intelligence
Know what every account
costs and earns.
Ask Limitr Analyst where the margin is, what a change would do, and what to do next. You get an answer you can ship, not a report to read.
Two of 214 accounts run below cost. Northwind is at −41%: heavy Opus usage on a Starter plan with no limit on it.
The problem
Billing knows what you charged,
not what it cost.
Invoices say what came in. Provider bills say what went out. Between them sit every account, feature, and model, and nobody can say which ones make money until the quarter closes.
Built on every call
Every number starts
with a call.
The engine prices each call at your price and your cost the moment it runs: customer, feature, model, plan, and contract. Limitr Cloud keeps the ledger.
What teams do with it
Ask for the outcome,
not the report.
Finance, revenue ops, and product ask in plain words. The Analyst answers with the numbers, then drafts the policy change, contract, or dashboard that acts on them.
Protect margin
Find the accounts, features, and models that cost more than they earn. Cap them, reprice them, or move them to a plan that fits, as one change you review.
Price with evidence
Replay last month's real traffic through a new price. See revenue, margin, and every account that pays more before anyone gets a new invoice.
Grow the right accounts
See which accounts are outgrowing their plan before they hit the limit, and draft the upgrade or the contract that keeps them growing.
Forecast the quarter
Revenue, cost to serve, and margin by account and plan, forecast from real usage. Walk into planning with numbers everyone trusts.
Dashboards
Dashboards the whole
team opens.
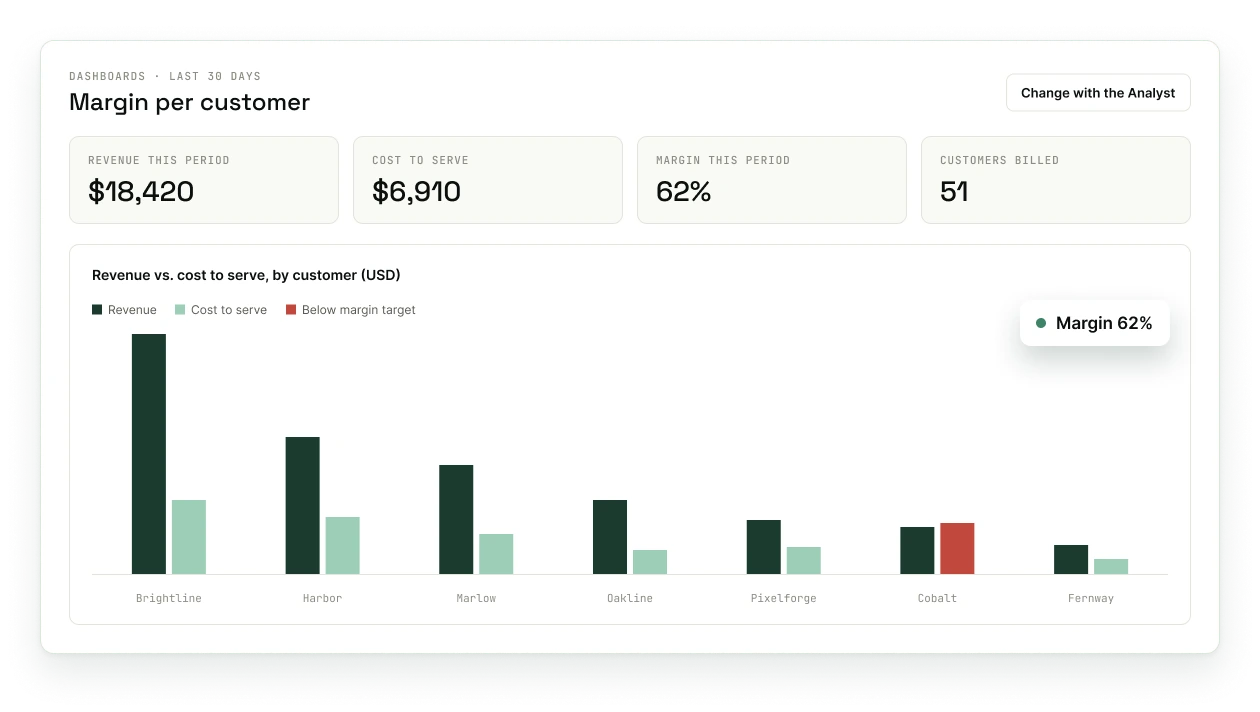
Ask for a view and save it: margin per customer, cost by model, revenue by segment, across every product and engine you run. Finance, product, and sales see the same numbers.
Customer story
The Regis Company
Regis meters real-time AI avatars inside its own backend for a Fortune 500 contract covering more than 100,000 users, so it knows what every session costs.
Read the story →